Examples#
Start the server if it’s not running:
cd $IOT_PROJECTS/mqtt-plot/code
python -m mqtt_plot
Open a browser window at http://iot49.local:5006.
Line Plot#
import paho.mqtt.client as mqtt
from time import sleep
import json, math, os


MQTT_BROKER = os.getenv("HOST_IP")
TOPIC_ROOT = "public/vis"

# start MQTT client for sending data
client = mqtt.Client(clean_session=True, protocol=mqtt.MQTTv311)
client.connect(MQTT_BROKER, port=1883, keepalive=60)

# initialize the plot
client.publish(f"{TOPIC_ROOT}/new", json.dumps({
    "columns": [ "time [s]", "sin^2", "cos" ],
    "rollover": 200,
    "args": { "title": "MQTT Plot Demo" },
}))

# send data
for i in range(500):
    client.publish(f"{TOPIC_ROOT}/add", json.dumps({
        "time [s]": i,
        "sin^2": math.sin(i/10)**2,
        "cos": math.cos(i/7)
    }))
    sleep(0.01)
Hint: In plots with many traces, click in the legend to show/hide outputs!
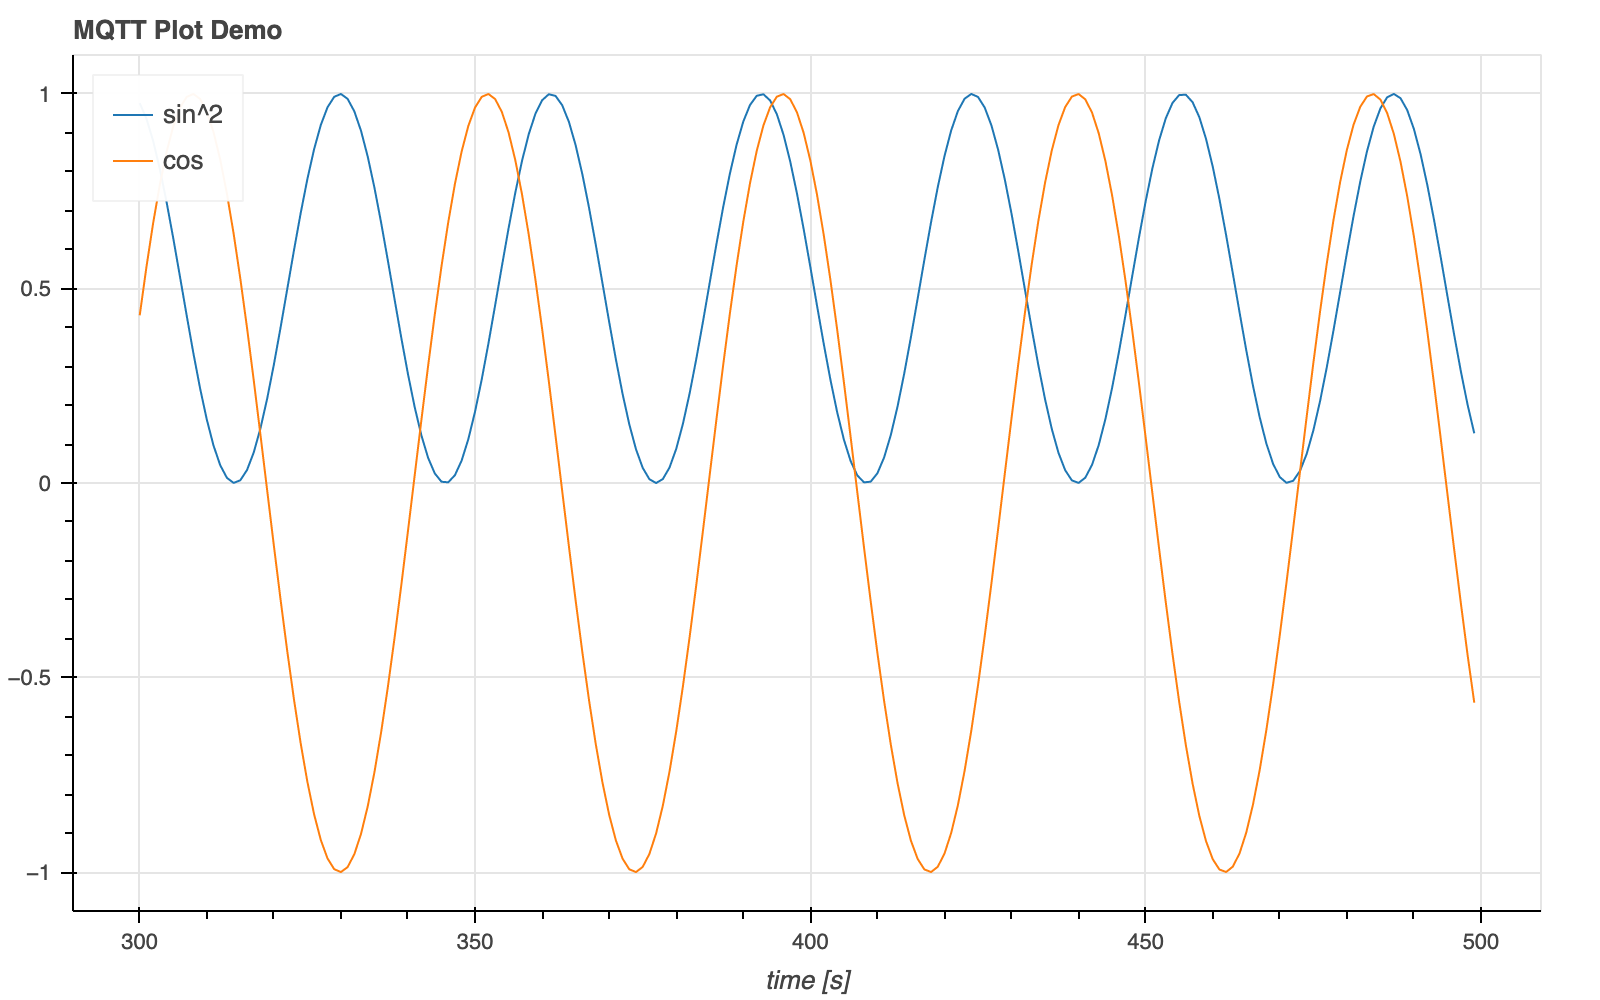
Fig. 18 MQTT Plot Demo#
Scatter Plot#
import paho.mqtt.client as mqtt
import json, os
from random import random


MQTT_BROKER = os.getenv("HOST_IP")
TOPIC_ROOT = "public/vis"

# start MQTT client for sending data
client = mqtt.Client(clean_session=True, protocol=mqtt.MQTTv311)
client.connect(MQTT_BROKER, port=1883, keepalive=60)

# initialize the plot
client.publish(f"{TOPIC_ROOT}/new", json.dumps({
    "columns": [ "x", "y1", "y2", "y3", "y4", "y5" ],
    "args": { "title": "Scatter Plot" },
    "layout": "scatter_plot"
}))

# send data
for i in range(40):
    client.publish(f"{TOPIC_ROOT}/add", json.dumps({
        "x":  random(),
        "y1": random(),
        "y2": random(),
        "y3": random(),
        "y4": random(),
        "y5": random(),
   }))
Binary Data#
Send data as an array of binary floats, rather than a json dict.
import paho.mqtt.client as mqtt
import json, math, os
from time import sleep
from struct import pack


MQTT_BROKER = os.getenv("HOST_IP")
TOPIC_ROOT = "public/vis"

# start MQTT client for sending data
client = mqtt.Client(clean_session=True, protocol=mqtt.MQTTv311)
client.connect(MQTT_BROKER, port=1883, keepalive=60)

# initialize the plot
client.publish(f"{TOPIC_ROOT}/new", json.dumps({
    "columns": [ "sin", "cos" ],
    "rollover": 300,
    "args": { "title": "Lissajous Figure" },
}))

# send data
for t in range(1000):
    tt = t/12
    client.publish(f"{TOPIC_ROOT}/bin", pack(f"!2f", math.sin(tt), math.cos(1.7*tt)))
    sleep(0.01)
NaN Values#
import paho.mqtt.client as mqtt
import json, math, os
from time import sleep
from struct import pack


MQTT_BROKER = os.getenv("HOST_IP")
TOPIC_ROOT = "public/vis"

# start MQTT client for sending data
client = mqtt.Client(clean_session=True, protocol=mqtt.MQTTv311)
client.connect(MQTT_BROKER, port=1883, keepalive=60)

client.publish(f"{TOPIC_ROOT}/new", json.dumps({
    "columns": [ "time [s]", "sin", "cos > 0" ],
    "rollover": 200,
    "args": { "title": "NaN values" },
}))

# send data
nan = float('nan')
for t in range(500):
    tt = t / 12
    s = math.sin(tt)
    c = math.cos(tt)
    clip = c if c > 0 else nan
    client.publish(f"{TOPIC_ROOT}/bin", pack(f"!3f", tt, s, clip))
    sleep(0.01)